MNB Color Scale for ggplot2
scale_color_mnb.RdThis function creates a color scale using the MNB color palette for ggplot2.
Examples
library(ggplot2)
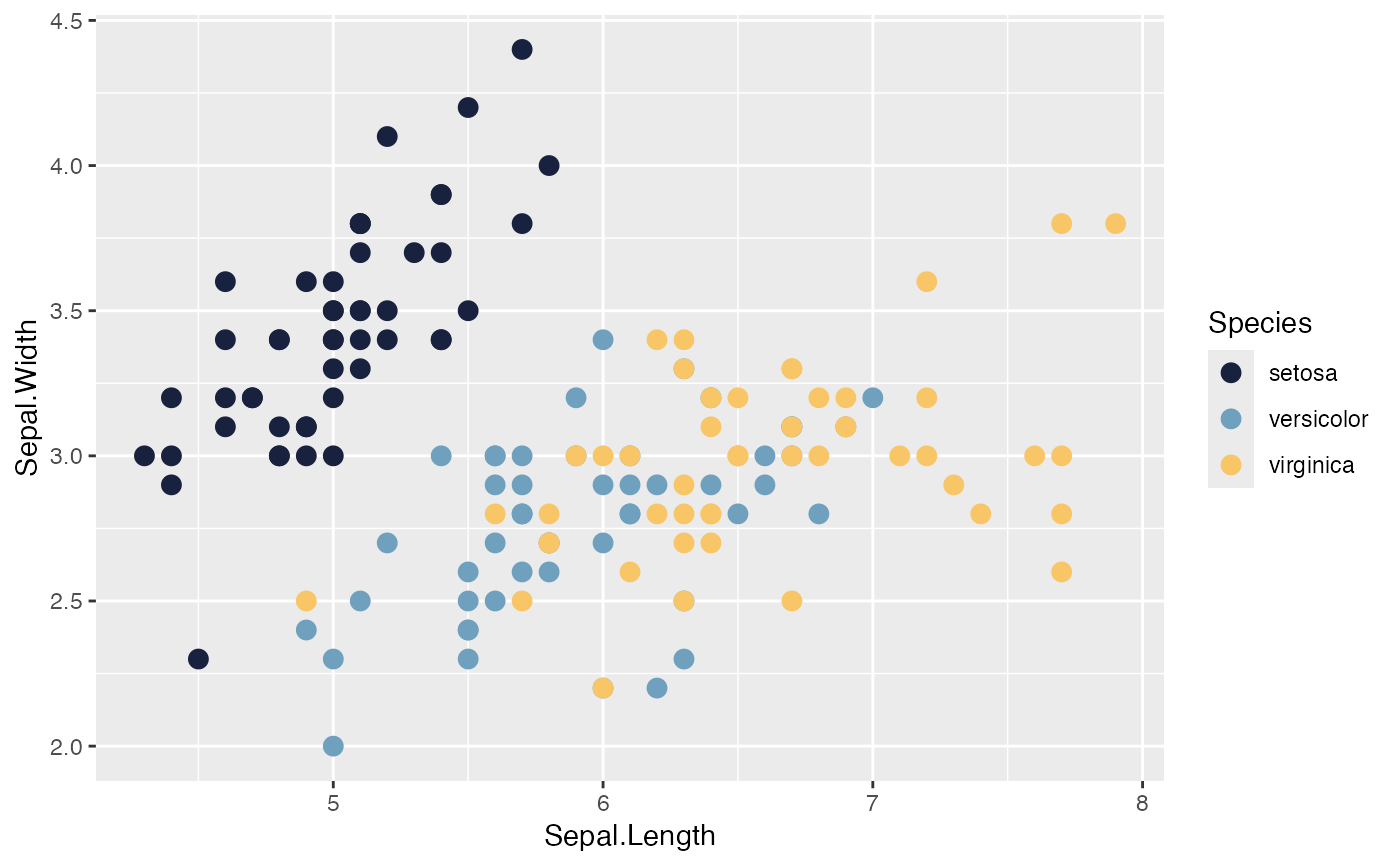
ggplot2::ggplot(iris) +
ggplot2::aes(Sepal.Length, Sepal.Width, color = Species) +
ggplot2::geom_point(size = 3) +
scale_color_mnb()
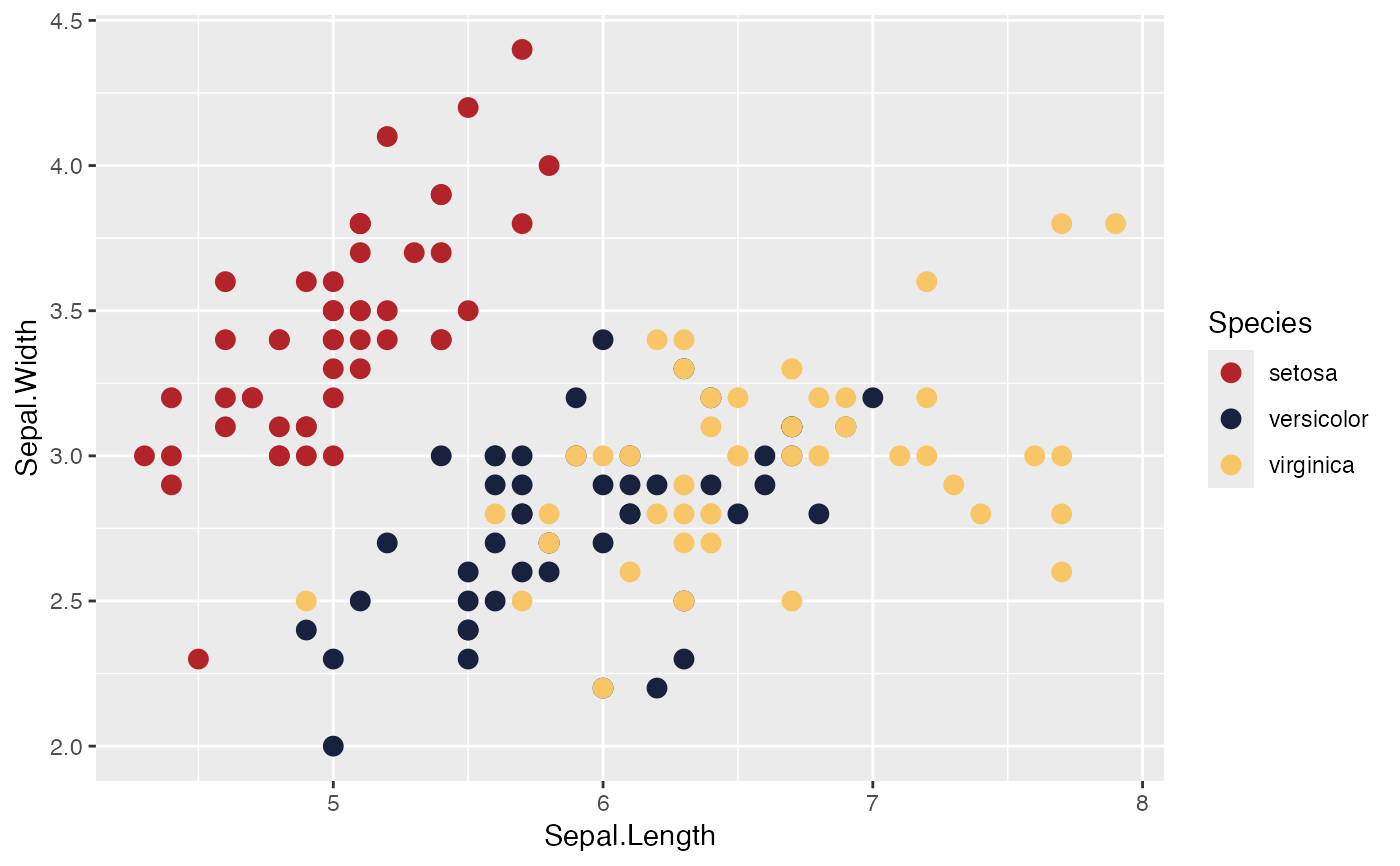
 ggplot2::ggplot(iris) +
ggplot2::aes(Sepal.Length, Sepal.Width, color = Species) +
ggplot2::geom_point(size = 3) +
scale_color_mnb(values = c("red4", "blue", "yellow"))
ggplot2::ggplot(iris) +
ggplot2::aes(Sepal.Length, Sepal.Width, color = Species) +
ggplot2::geom_point(size = 3) +
scale_color_mnb(values = c("red4", "blue", "yellow"))